Home
Indicators
Countries
About
Back

Share

Embed

Figure

Dataset

Access and completion

Primary completion rateLower secondary completion rateUpper secondary completion rateOut-of-school childrenOut-of-school adolescentsOut-of-school youthNever been to schoolOver-age primary school attendance

Learning

Learning achievement in reading (Early grades)Learning achievement in reading (End of primary)Learning achievement in reading (End of lower secondary)Learning achievement in mathematics (Early grades)Learning achievement in mathematics (End of primary)Learning achievement in mathematics (End of lower secondary)Learning achievement in science (End of primary)Learning achievement in science (End of lower secondary)
AlbaniaArgentinaAustraliaAustriaAzerbaijanBahrainBangladeshBelarusBeninBotswanaBrazilBulgariaBurkina FasoBurundiCameroonC. A. R.ChadChileColombiaCongoCosta RicaCôte d'IvoireCroatiaCyprusCzechiaDenmarkDominican Rep.D. R. CongoEcuadorEgyptFinlandFranceGabonGambiaGeorgiaGermanyGhanaGuatemalaGuineaGuinea-BissauGuyanaHondurasHong Kong, ChinaHungaryIcelandIran, Isl. Rep.IrelandIsraelItalyJordanKazakhstanKiribatiKyrgyzstanLatviaLithuaniaMacao, ChinaMadagascarMaltaMexicoMongoliaMontenegroMoroccoNepalNetherlandsNew ZealandNicaraguaNigerNorth MacedoniaNorwayOmanPalestinePanamaParaguayPeruPolandPortugalQatarRussian Fed.SamoaSaudi ArabiaSenegalSerbiaSierra LeoneSingaporeSlovakiaSloveniaSouth AfricaSpainS. Tome/PrincipeSurinameSwedenThailandTogoTongaTunisiaTurkeyTurkmenistanU. A. EmiratesUnited StatesUruguayUzbekistanZimbabwe

Percentage of children of primary school age taking part in a reading assessment passing four levels of increasing difficulty

UNESCO Home

GEM Report Home

UIS Home

Terms and Conditions

Disclaimer

Cookies consent
We use cookies to better understand what information is useful for our users, and to enhance future versions of the report.
No personal information is collected.

Browse data

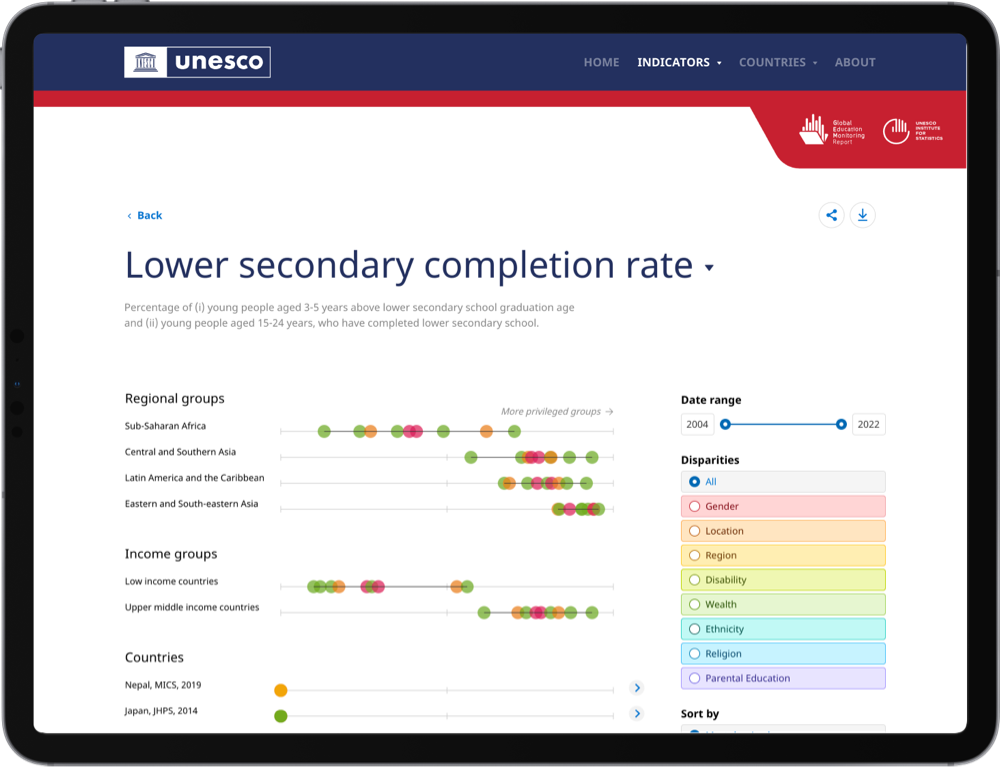
Start by exploring a specific completion or learning indicator for all countries available. Alternatively, you can view all the figures we have calculated for the country of your interest. The colours of the visualization represent the dimensions where inequalities arise.

Skip
screenshot