Access and completion
Primary completion rateLower secondary completion rateUpper secondary completion rateOut-of-school childrenOut-of-school adolescentsOut-of-school youthMean years of educationPre-primary education attendanceNever been to schoolLess than 2 years of schoolingLess than 4 years of schoolingOver-age primary school attendanceTransition rate to lower secondary schoolTransition rate to upper secondary schoolHigher education attendanceTertiary completion rateFilters
Disability | ||
20–24, MICS, 2017 | ||
Gender | ||
20–24, MICS, 2017 | ||
Location | ||
20–24, MICS, 2017 | ||
Parental education | ||
20–24, MICS, 2017 | ||
Region | ||
20–24, MICS, 2017 | ||
Wealth | ||
20–24, MICS, 2017 |
Disparities
Age Group
Years
Browse data
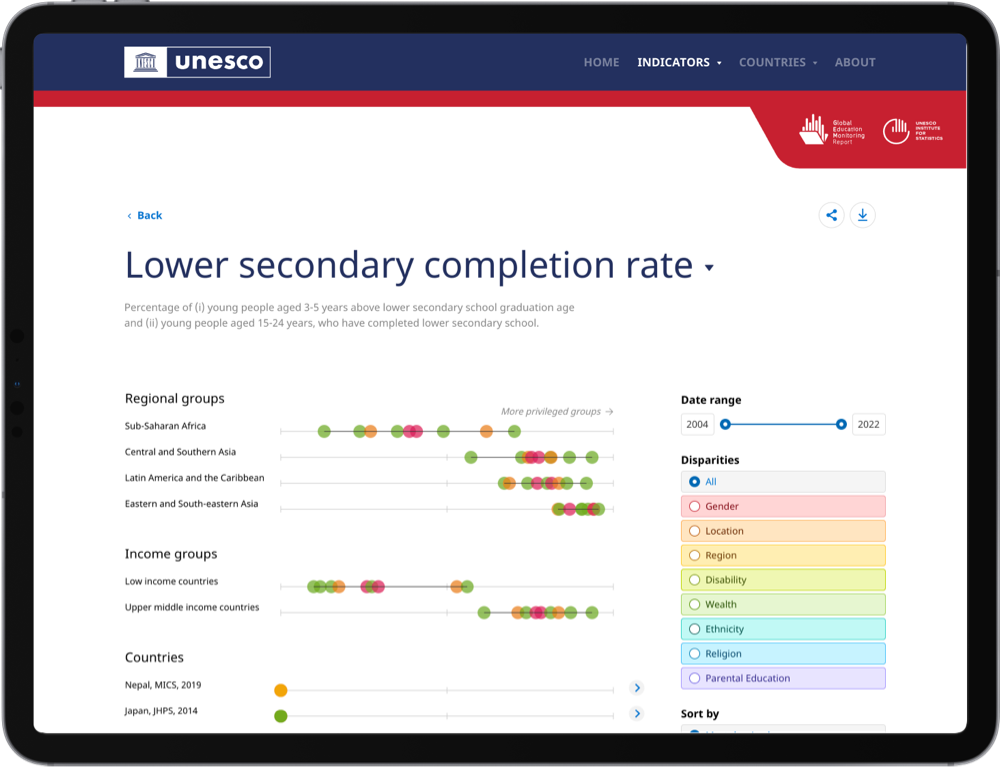
Start by exploring a specific completion or learning indicator for all countries available. Alternatively, you can view all the figures we have calculated for the country of your interest. The colours of the visualization represent the dimensions where inequalities arise.